ChamP - N. Harold Cham's 6502/65C02 Profiler
6502 Assembler: Profiling your assembly code
ChamP is a 6502/65C02 emulator / profiler that enables you to really get to know where you spend your cycles in your code.
Features
- full, cycle-accurate 6502/65C02 emulation
- HIRES screen output as animated GIF with exact frame timing
- calculation of average frame rate (if desired)
- see how much time is spent in which subroutine
- watch variables (single variables or pairs)
- no required dependencies except Ruby, gcc and Merlin32
- optional: GraphViz if you want a call graph
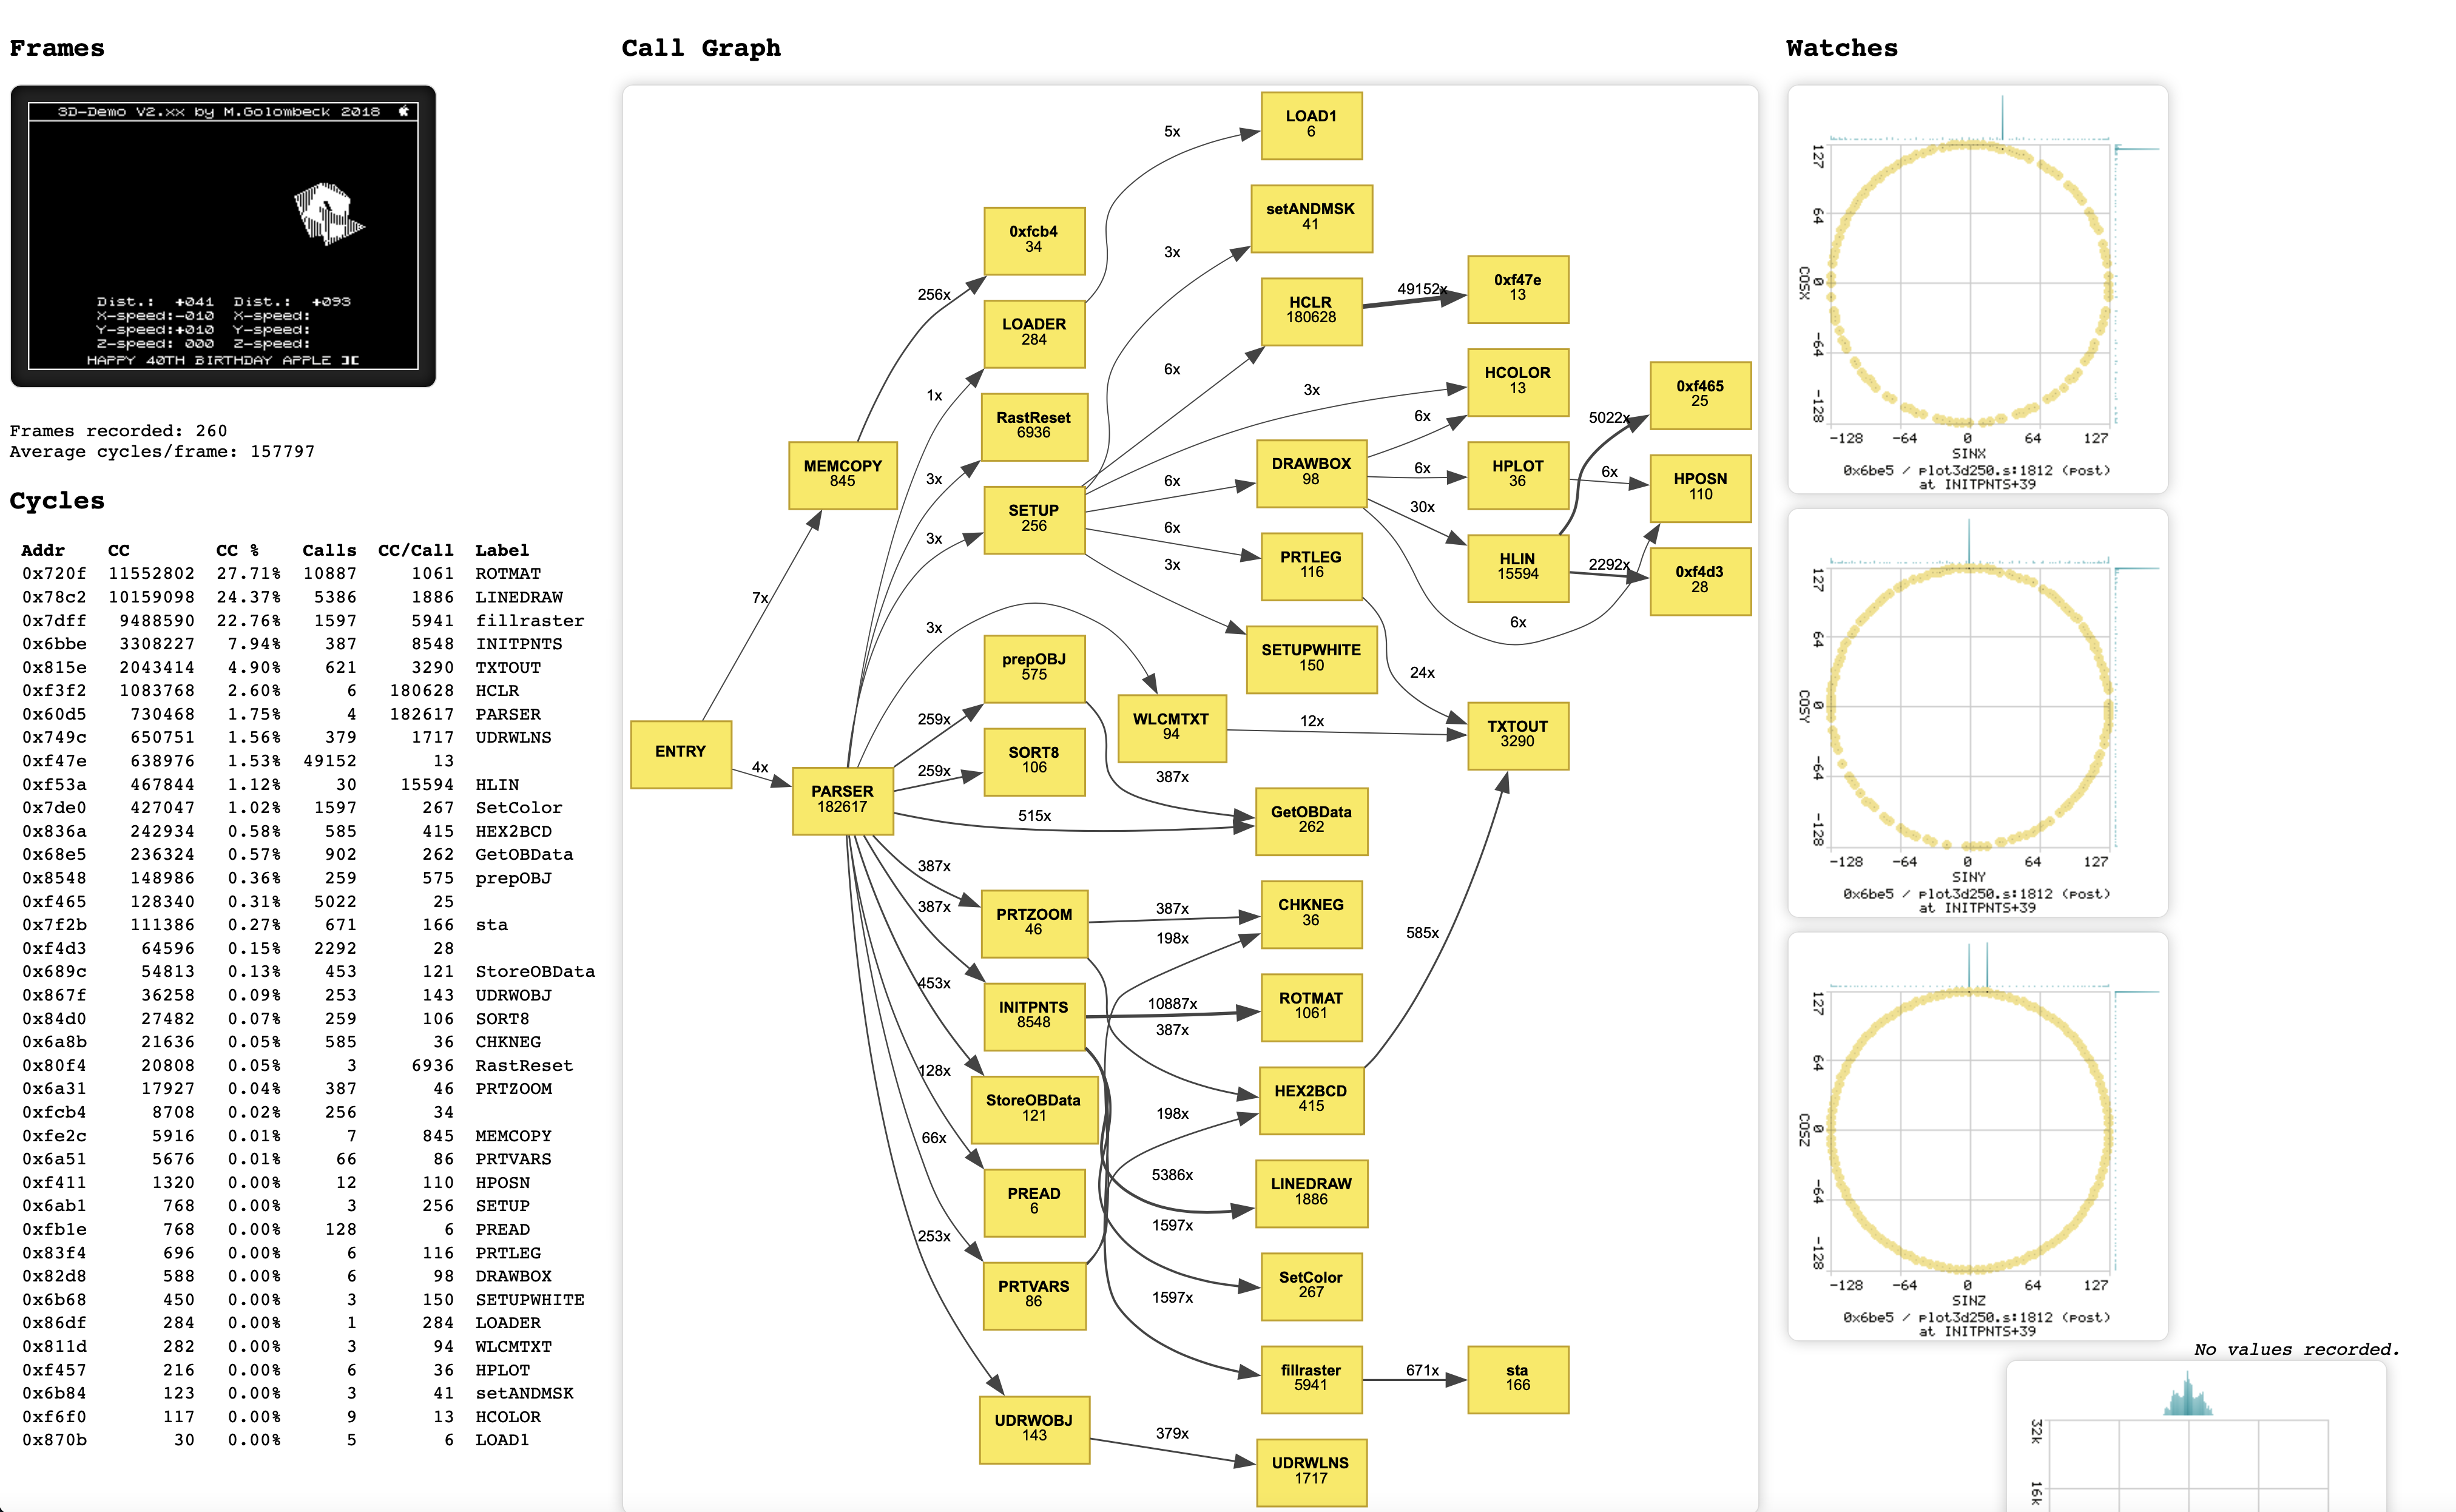
Example complex call graph of the 3D-Engine:
Getting ChamP
ChamP can be downloaded from GitHub for free.
Find extensive instructions and examples on how to use ChamP in your project there!
Simple Example
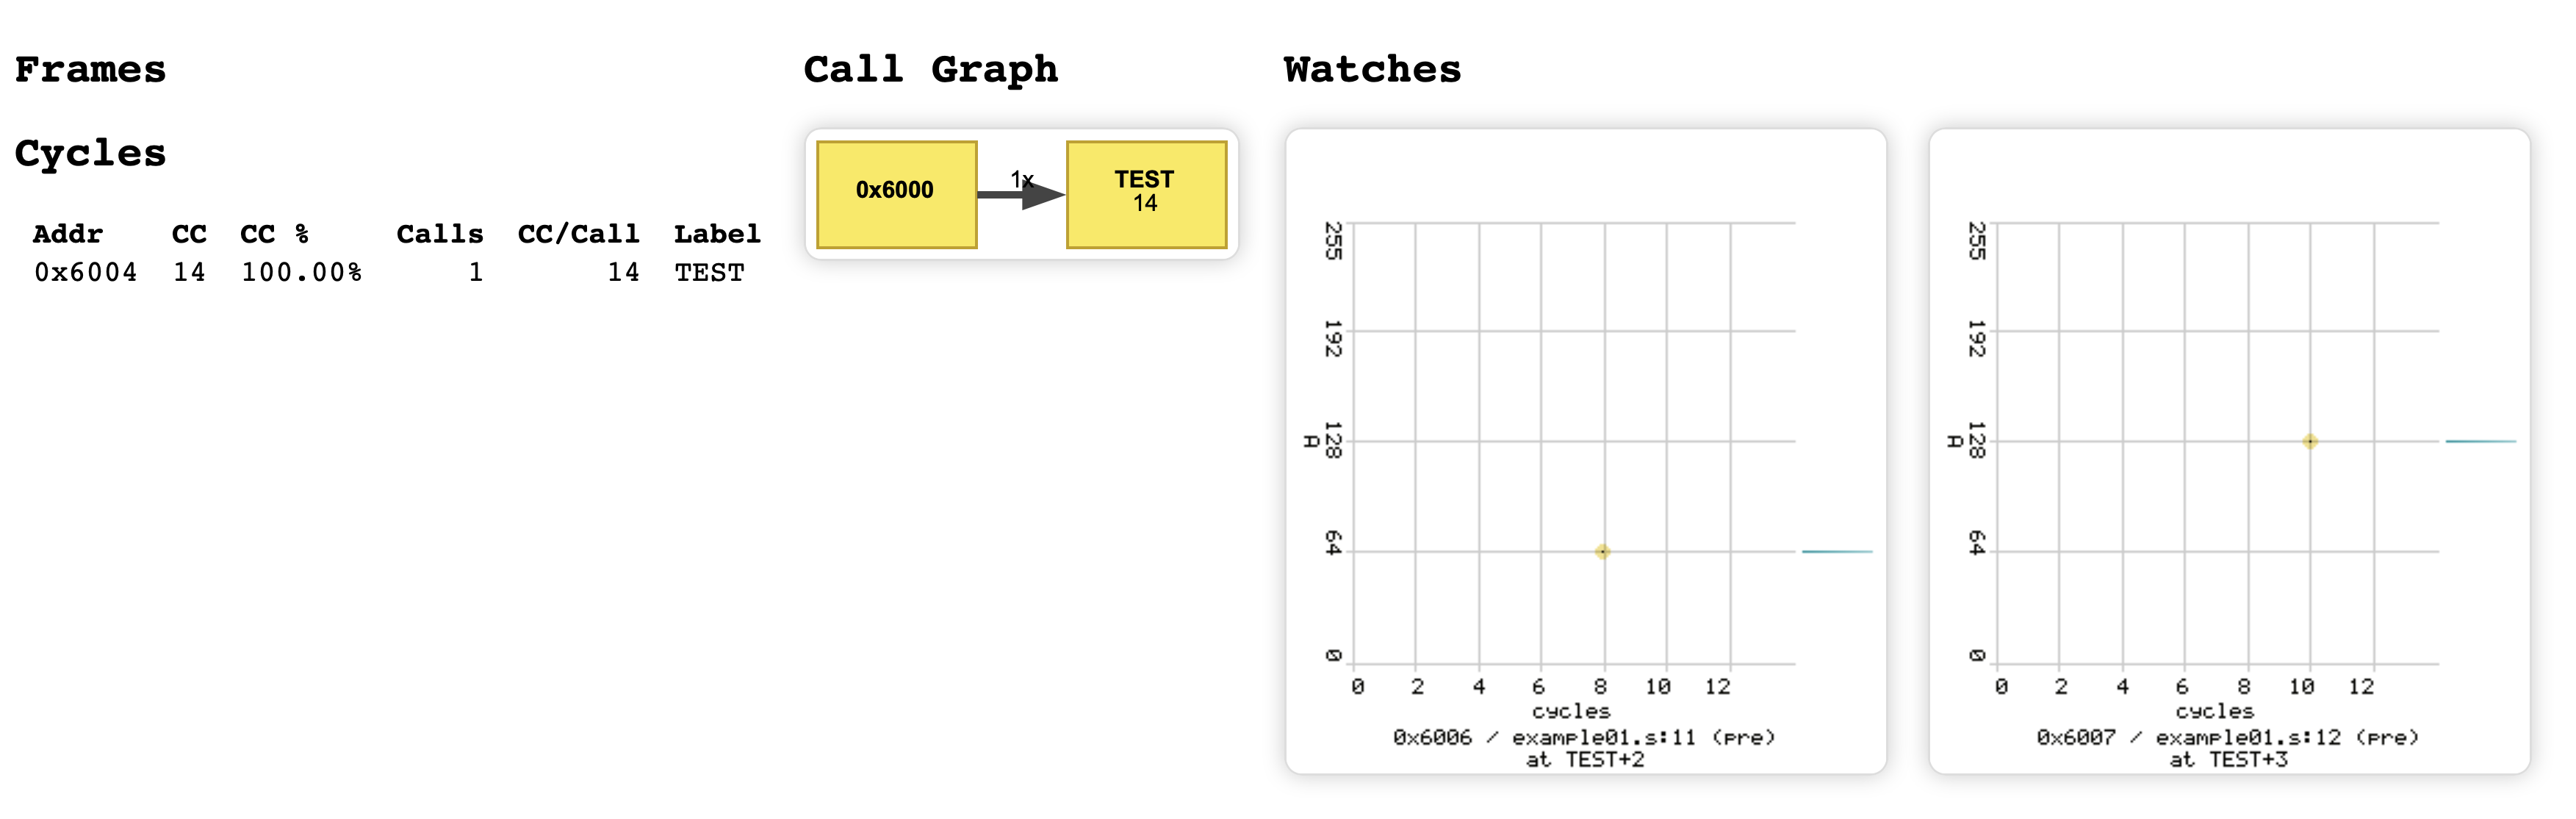
The following example basically demonstrates how ChamP works. The example calls a subroutine TEST where the value #64 is loaded, doubled and stored. This all takes 14 CPU cycles.
You can watch registers or variables at certain program counter addresses by inserting a champ directive in a comment after the respective code line in your assembler source code. All champ directives start with an at sign (@).
 1        DSK test
 2        MX %11
 3        ORG $6000
 4
 5FOO     EQU $8000
 6
 7        JSR TEST
 8        BRK
 9
10TEST    LDA #64         ; load 64 into accumulator
11        ASL             ; multiply by two @Au
12        STA FOO         ; store result @Au
13        RTS
ChamP returns the cycles needed for the subroutine TEST. Furthermore there are two WATCHes defined with @Au where the accumulator is stored as unsigned byte value and displayed in a graph in the report file before the operation in that line gets executed.
The call graph is pretty small here since only one subroutine gets called. Furthermore no output frames in form of a GIF-image get created since the screen is not grabbed here in this example.
Error reporting
Should your program run into an error, champ shows you where in the source code the error occured and an execution log of the previous 20 CPU steps (you can increase the size of the log with --error-log-size).
Look at this example which creates a stack overflow:
1        DSK test
2        MX %11
3        ORG $6000
4
5        LDX #$ff
6COUNT   PHA
7        PHA
8        DEX
9        BNE COUNT
This is a program which repeatedly pushes the accumulator onto the stack until the stack is full. Stack overflow, mission accomplished! Champ will generate the following output:
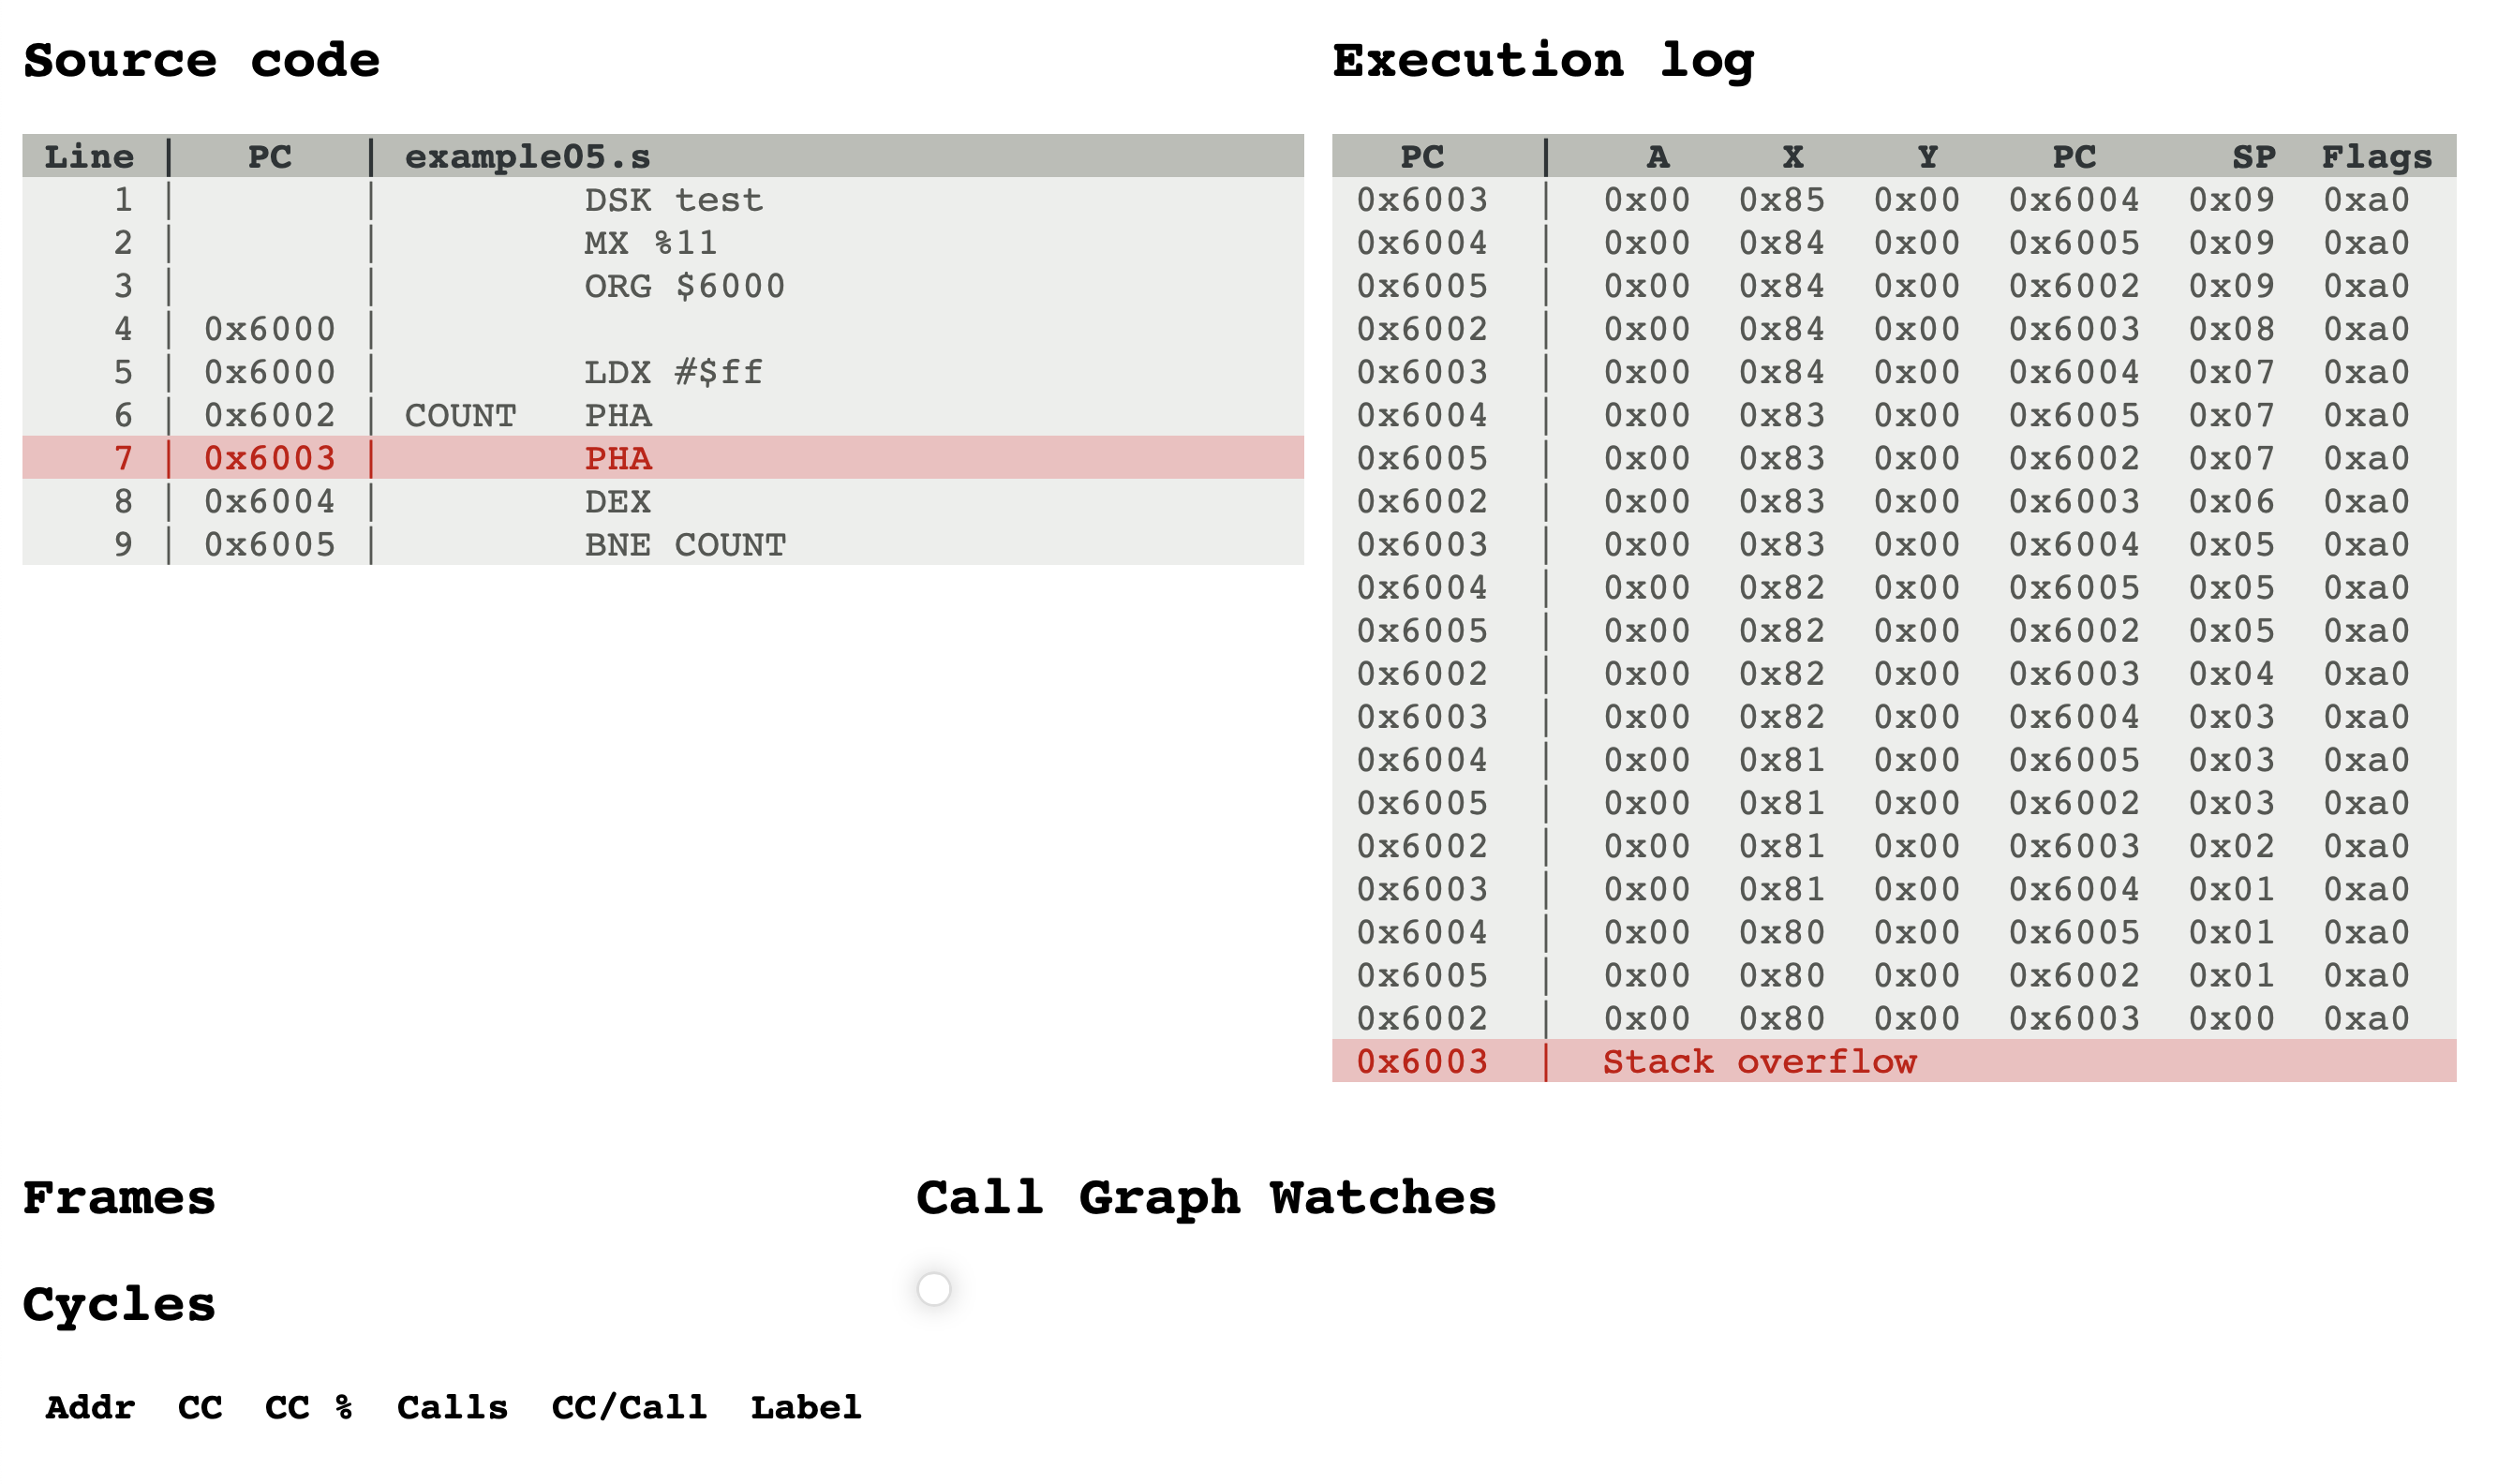
PHA operation when SP is already down to zero from previous PHA operations (as can be seen on the right).